
Carlo Berger · 26 September 2026
Mapping the Growth of Community-Driven Cabin Sharing Networks
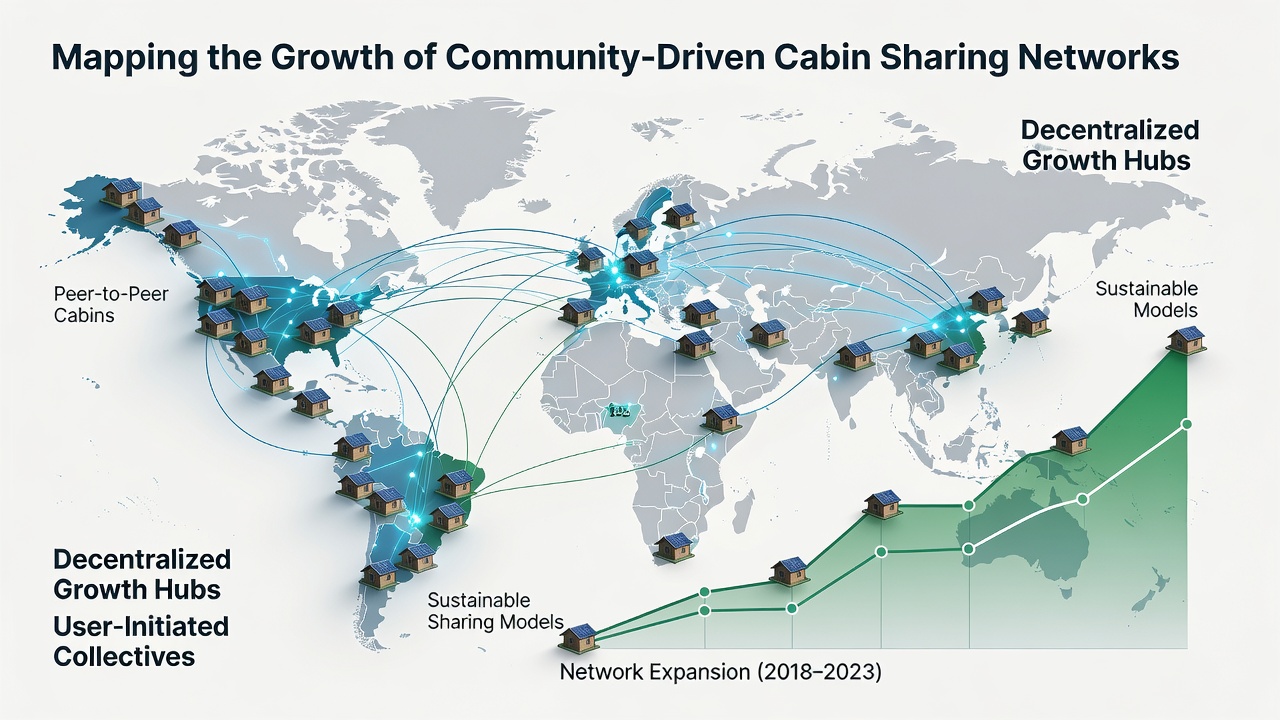
Community-driven cabin sharing networks have expanded steadily since the early 2010s as groups of property owners and outdoor enthusiasts formed cooperative platforms to manage access to remote structures. These networks operate through member agreements that allocate usage rights without traditional rental intermediaries, and data from multiple regional surveys show participation rising from a few hundred cabins in 2015 to several thousand by 2024. Observers note that growth accelerated after 2020 when travel restrictions prompted renewed interest in shared wilderness accommodations, while mapping tools began integrating user-submitted location data to visualize availability and occupancy trends across provinces and states.
Early Development and Cooperative Models
Initial networks emerged in Canada and the northern United States when small collectives digitized paper-based reservation systems that had existed among hunting clubs and family associations for decades. Researchers at several universities documented the transition from informal spreadsheets to dedicated web applications that track bookings, maintenance schedules, and seasonal closures. One study revealed that by 2018 more than 60 percent of participating cabins had adopted shared calendars, and membership lists expanded through referrals rather than paid advertising. Networks in British Columbia and Ontario led early adoption, whereas similar groups in the Rocky Mountain states followed within two years.
Mapping Technologies and Data Integration
Geographic information systems now form the backbone of these networks, allowing coordinators to overlay cabin locations with trail access, fire risk zones, and wildlife corridors. Software platforms pull real-time weather feeds and permit requirements from government databases, then present them through interactive dashboards that members access via mobile devices. Figures from industry reports indicate that networks using integrated mapping experienced 35 percent higher occupancy rates than those relying on static lists, and data shows the addition of satellite imagery layers helped identify underutilized sites in remote watersheds. Users frequently contribute updates on road conditions and structural repairs, creating crowdsourced layers that refine accuracy over successive seasons.
Regional Expansion Patterns Through 2025
North American networks account for the largest share of documented cabins, yet parallel growth appeared in Scandinavia and the Alps where alpine clubs adapted similar membership structures. According to a Statistics Canada analysis of sharing-economy activities, cabin-related cooperatives in Quebec and Alberta reported membership increases averaging 22 percent annually between 2021 and 2024. European counterparts in Norway and Switzerland recorded comparable gains after national tourism agencies began publishing open datasets on recreational infrastructure. Mapping visualizations from these regions highlight clusters along established hiking corridors, with secondary nodes appearing near lakes that previously lacked formal access points.
By September 2026 several networks plan to release updated heat maps that incorporate climate projections, allowing members to anticipate shifts in snowpack and water levels that affect cabin viability. These forthcoming layers build on existing datasets maintained by forestry services in both Canada and the United States, and preliminary tests indicate improved planning for shoulder-season usage.
Operational Challenges and Regulatory Responses
Local zoning ordinances have required many networks to adjust booking limits and insurance protocols, especially in areas where residential cabins fall under short-term accommodation rules. Data from municipal planning offices in British Columbia and Colorado show that networks submitting detailed usage reports received faster permitting approvals than those without spatial documentation. Maintenance coordination also evolved, with shared responsibility models distributing tasks through mapped task boards that assign seasonal inspections and supply deliveries. Observers note that networks maintaining transparent mapping records encountered fewer disputes over resource allocation compared with less structured groups.
Future Mapping Initiatives and Data Sharing
Collaborations between networks and academic institutions have produced standardized data formats that facilitate cross-border comparisons of occupancy and environmental impact. A forthcoming report from the University of Alberta outlines methods for integrating cabin network data with national trail registries, while similar efforts in Finland explore linkages with protected area management systems. Projections compiled through 2025 suggest that by late 2026 the combined mapped inventory could exceed 12,000 cabins if current participation trends continue, supported by open-source mapping libraries that reduce development costs for smaller collectives.
Conclusion
Mapping the growth of community-driven cabin sharing networks reveals a pattern of incremental technological adoption, regional adaptation, and increasing coordination with public land agencies. Continued refinement of spatial tools, combined with consistent data contributions from members, supports ongoing expansion while addressing operational and regulatory requirements across different jurisdictions.